
Last week, Google announced via Twitter handle Google Webmasters (@googlewmc) that it has made some changes to the Search Console. Instead of showing the usual 30 days-worth of data, the Performance report now shows a full 90-day clicks report for Discovery and Search Results.
“If you have Discover data available on your Search Console account, we are making a small tweak to the Performance report: we’re changing the default time range of the Discover and Search bars to 90 full days.”
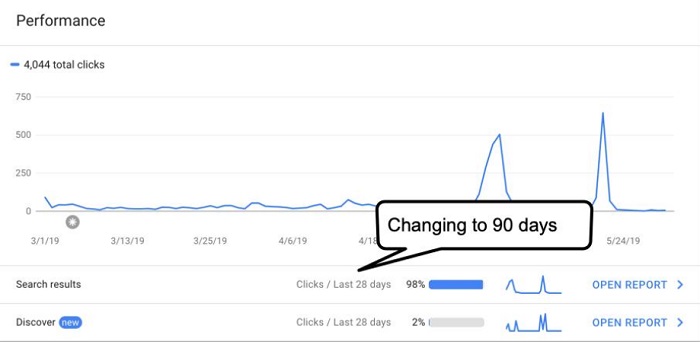
Meaning, you’ll see some slight changes to the data being shown for clicks from the Discovery and Search Results.
Discovery and Search Results Update
While the update is just considered as a small change, it’s deemed useful by SEOs and marketers who want to have a better view of how their pages are performing.
Discovery for Search Console is a relatively new feature launched last April by Google to help marketers, publishers, and site owners know how people find their websites. It was initially launched last 2017 for Google Search to help users get updates about their favorite online topics.
Since then, Google has seen the Discovery’s exponential growth, helping over 800 million Google Search users find matching videos, articles, and other content.
With Discovery included on Google Search Console, marketers and publishers can now get the latest insight into the performance of their Search Discovery.
However, the 90-day Discovery report is only available to sites who have significantly grown their online visibility. It can be configured according to the data needs of the Search Console user. Below is a quick guide to configuring Performance for Discovery.
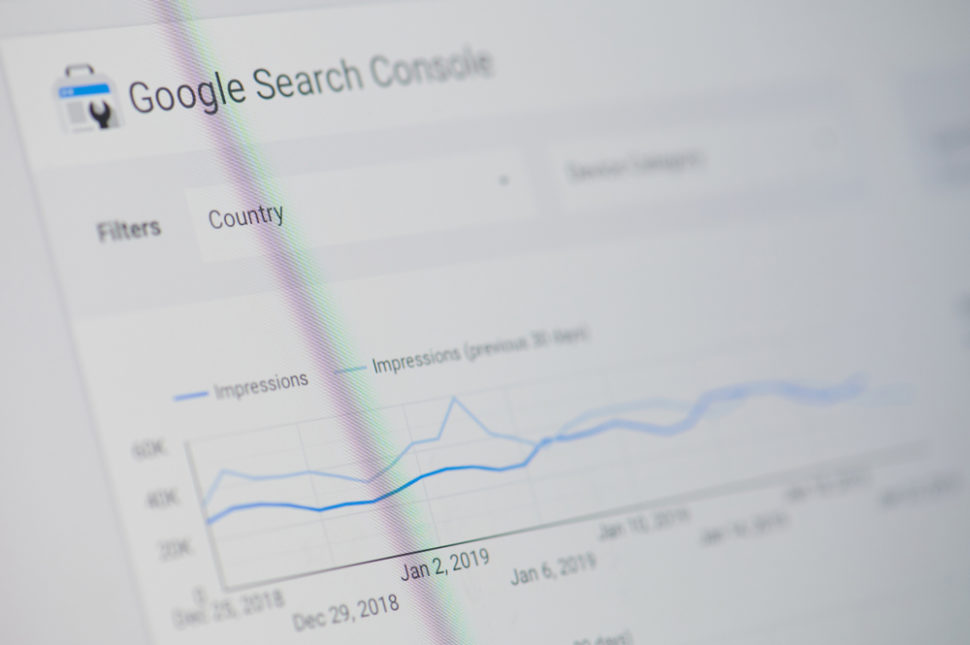
Configuring the report
The default view of the report shows the clicks, impressions, and average CTR (click-through rate) for your property.
- Choose which metrics to see by selecting the desired metrics above the chart. Metrics are the numbers to show (clicks, impressions, CTR).
- Choose which dimension to show by selecting a data grouping tab in the table. The dimension defines how data is grouped. Discover supports the dimensions of page and country.
- Optionally filter your data by date, dimension, and so on.
- Optionally compare dimension groups: for example, you can compare impressions from Brazil and China.


Comments (0)
Most Recent