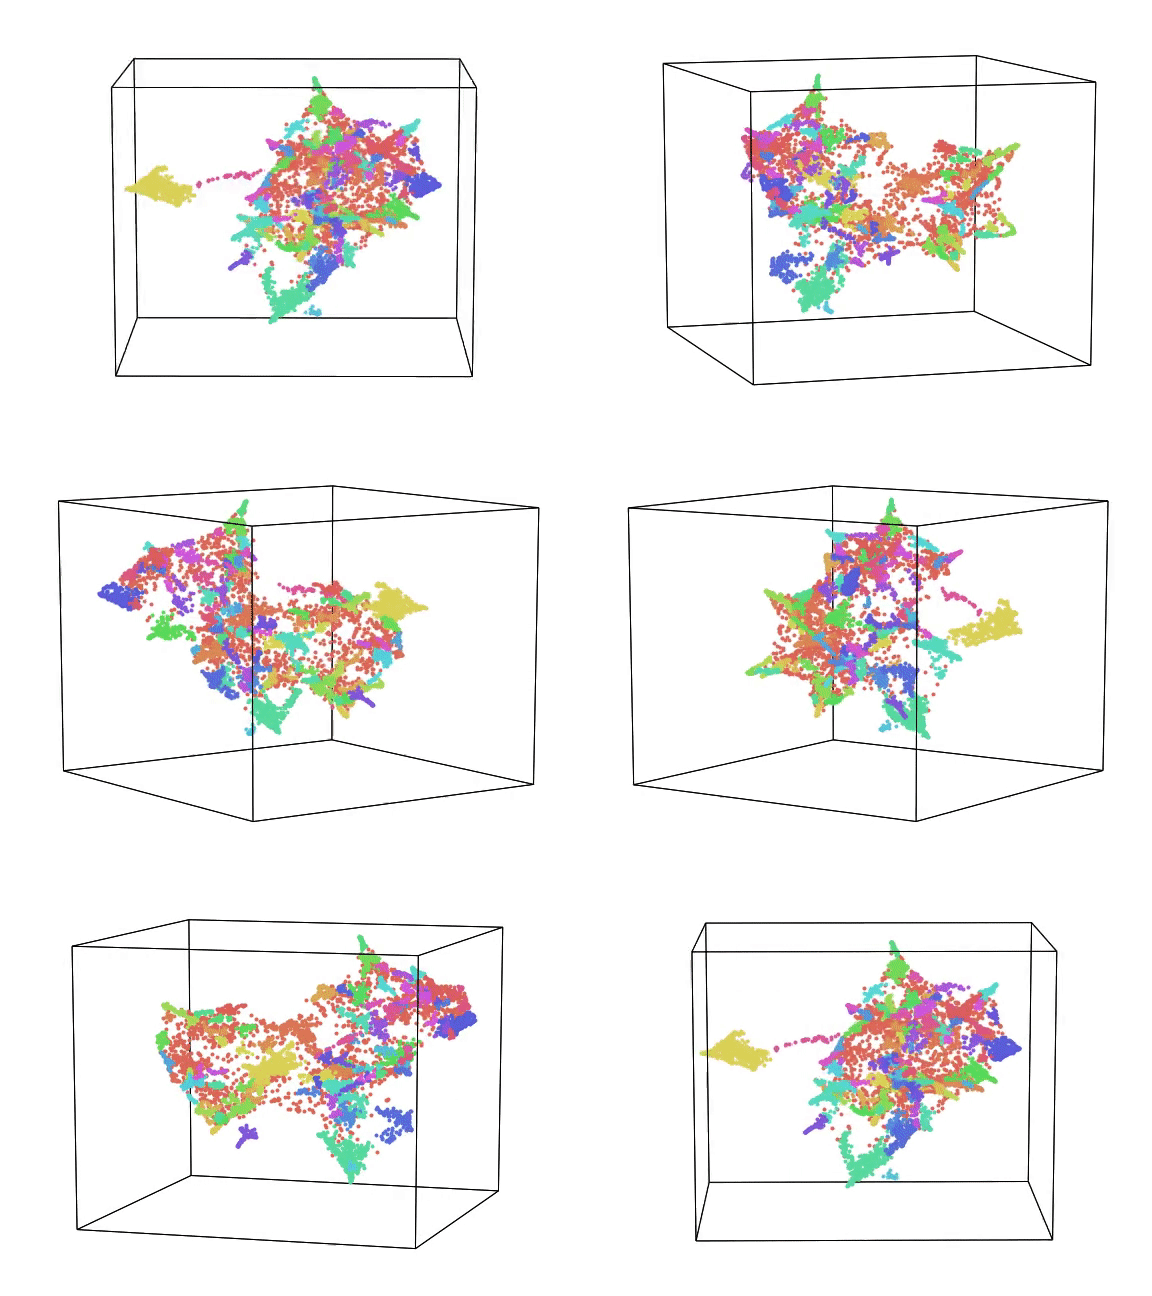
A team of researchers from Dartmouth College has developed a new software called HyperTools to make visualization of complex datasets easier.
It is said that in the observable universe, every dataset has a corresponding fundamental shape to it. However, the structure of that said shape could be highly complicated. So, Dartmouth College researchers created HyperTools.
HyperTools is an open-source software package that utilizes a set of mathematical methodologies to gain so-called insights about the “high-dimensional datasets” using the underlying geometric structures that they reflect.
The team’s paper on their work was published in the Journal of Machine Learning Research.
Read More: Introducing: Quantum Machine Learning
According to researchers, HyperTools could be utilized in transforming data into its visualizable shapes or animations. This technique could be beneficial in accomplishing the following:
- comparing different datasets
- gaining insights into underlying patterns in an intuitive way
- making generalizations across datasets
- developing and testing theories relating to the Big Data
“The datasets we’re faced with as modern scientists can be enormously complex, often reflecting many interacting components,” Jeremy R. Manning, an assistant professor of psychological and brain sciences and director of the Contextual Dynamics Lab at Dartmouth, said.
“Our tool turns complex data into intuitive 3-D shapes that can be visually examined and compared. Essentially, we are leveraging the visual system’s amazing ability to find patterns in the world around us to also find patterns in complex scientific data.”

In their paper, the researchers demonstrated how the HyperTools could be applied and used in many different kinds of data. The team was able to visualize brain activity, movie frames and brain responses while watching those frames, and the changes in temperature measurements across our planet’s surface from 1875 to 2013.
The team was also able to make a visualization of the thematic content of political tweets issued by both then-2016 U.S. presidential candidates Hillary Clinton and Donald Trump.
Read More: 5 Ways to Improve Your Small Business Using Big Data
HyperTools also provide insights that can be used to guide the development of many machine learning algorithms. For instance, visualizations could expose the varying types of observations from distinct structured clusters and use it to understand similarities and differences between groups better.
Since HyperTools is an open-source software, the researchers are expecting that other interested parties would further harness the concept and eventually pave a firmer road to the fields of Big Data and machine learning.


Comments (0)
Most Recent